Comparing samplers#
In this tutorial, we are comparing two different sampling schemes on the
mcycle dataset with a Gaussian location-scale regression model and two
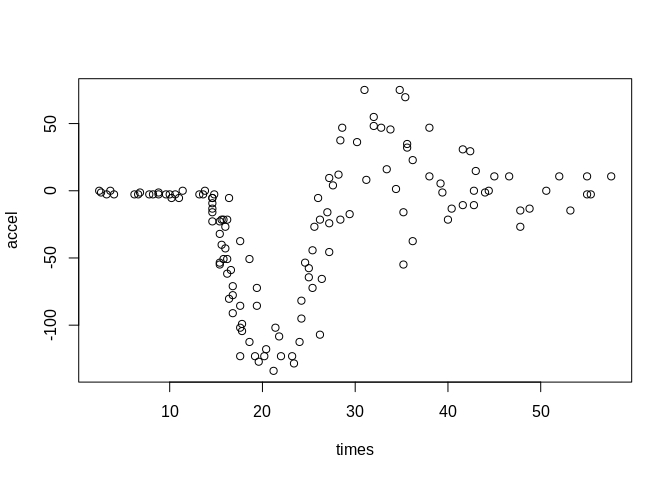
splines for the mean and the standard deviation. The mcycle dataset is
a “data frame giving a series of measurements of head acceleration in a
simulated motorcycle accident, used to test crash helmets” (from the
help page). It contains the following two variables:
times: in milliseconds after impactaccel: in g
We start off in R by loading the dataset and setting up the model with
the rliesel::liesel() function.
library(MASS)
library(rliesel)
Please make sure you are using a virtual or conda environment with Liesel installed, e.g. using `reticulate::use_virtualenv()` or `reticulate::use_condaenv()`. See `vignette("versions", "reticulate")`.

After setting the environment, check if the installed versions of RLiesel and Liesel are compatible with `check_liesel_version()`.
data(mcycle)
with(mcycle, plot(times, accel))
model <- liesel(
  response = mcycle$accel,
  distribution = "Normal",
  predictors = list(
    loc = predictor(~ s(times)),
    scale = predictor(~ s(times), inverse_link = "Exp")
  ),
  data = mcycle
)
Installed Liesel version 0.2.4 is compatible.
Metropolis-in-Gibbs#
First, we try a Metropolis-in-Gibbs sampling scheme with IWLS kernels for the regression coefficients (\(\boldsymbol{\beta}\)) and Gibbs kernels for the smoothing parameters (\(\tau^2\)) of the splines.
import liesel.model as lsl

model = r.model

builder = lsl.dist_reg_mcmc(model, seed=42, num_chains=4)
builder.set_duration(warmup_duration=5000, posterior_duration=1000)

engine = builder.build()
liesel.goose.engine - INFO - Initializing kernels...
liesel.goose.engine - INFO - Done
engine.sample_all_epochs()
liesel.goose.engine - INFO - Starting epoch: FAST_ADAPTATION, 75 transitions, 25 jitted together
liesel.goose.engine - WARNING - Errors per chain for kernel_01: 0, 1, 1, 0 / 75 transitions
liesel.goose.engine - WARNING - Errors per chain for kernel_02: 1, 1, 1, 1 / 75 transitions
liesel.goose.engine - INFO - Finished epoch
liesel.goose.engine - INFO - Starting epoch: SLOW_ADAPTATION, 25 transitions, 25 jitted together
liesel.goose.engine - WARNING - Errors per chain for kernel_01: 1, 1, 0, 0 / 25 transitions
liesel.goose.engine - INFO - Finished epoch
liesel.goose.engine - INFO - Starting epoch: SLOW_ADAPTATION, 50 transitions, 25 jitted together
liesel.goose.engine - WARNING - Errors per chain for kernel_01: 0, 0, 1, 0 / 50 transitions
liesel.goose.engine - INFO - Finished epoch
liesel.goose.engine - INFO - Starting epoch: SLOW_ADAPTATION, 100 transitions, 25 jitted together
liesel.goose.engine - WARNING - Errors per chain for kernel_01: 0, 0, 0, 1 / 100 transitions
liesel.goose.engine - INFO - Finished epoch
liesel.goose.engine - INFO - Starting epoch: SLOW_ADAPTATION, 200 transitions, 25 jitted together
liesel.goose.engine - WARNING - Errors per chain for kernel_01: 0, 0, 0, 1 / 200 transitions
liesel.goose.engine - INFO - Finished epoch
liesel.goose.engine - INFO - Starting epoch: SLOW_ADAPTATION, 400 transitions, 25 jitted together
liesel.goose.engine - WARNING - Errors per chain for kernel_01: 0, 1, 1, 1 / 400 transitions
liesel.goose.engine - INFO - Finished epoch
liesel.goose.engine - INFO - Starting epoch: SLOW_ADAPTATION, 800 transitions, 25 jitted together
liesel.goose.engine - WARNING - Errors per chain for kernel_01: 1, 1, 1, 1 / 800 transitions
liesel.goose.engine - INFO - Finished epoch
liesel.goose.engine - INFO - Starting epoch: SLOW_ADAPTATION, 3300 transitions, 25 jitted together
liesel.goose.engine - WARNING - Errors per chain for kernel_01: 1, 0, 1, 0 / 3300 transitions
liesel.goose.engine - INFO - Finished epoch
liesel.goose.engine - INFO - Starting epoch: FAST_ADAPTATION, 50 transitions, 25 jitted together
liesel.goose.engine - WARNING - Errors per chain for kernel_01: 0, 1, 0, 0 / 50 transitions
liesel.goose.engine - INFO - Finished epoch
liesel.goose.engine - INFO - Finished warmup
liesel.goose.engine - INFO - Starting epoch: POSTERIOR, 1000 transitions, 25 jitted together
liesel.goose.engine - INFO - Finished epoch
Clearly, the performance of the sampler could be better, especially for the intercept of the mean. The corresponding chain exhibits a very strong autocorrelation.
import liesel.goose as gs

results = engine.get_results()
gs.Summary(results)
Parameter summary:
| kernel | mean | sd | q_0.05 | q_0.5 | q_0.95 | sample_size | ess_bulk | ess_tail | rhat | ||
|---|---|---|---|---|---|---|---|---|---|---|---|
| parameter | index | ||||||||||
| loc_np0_beta | (0,) | kernel_04 | -123.925 | 252.403 | -529.979 | -136.899 | 310.361 | 4000 | 32.770 | 283.680 | 1.093 |
| (1,) | kernel_04 | -1443.933 | 242.040 | -1857.528 | -1438.059 | -1052.284 | 4000 | 154.026 | 326.176 | 1.025 | |
| (2,) | kernel_04 | -713.112 | 170.964 | -996.168 | -709.703 | -427.398 | 4000 | 157.377 | 733.196 | 1.027 | |
| (3,) | kernel_04 | -566.761 | 106.593 | -742.514 | -566.403 | -392.259 | 4000 | 345.613 | 699.904 | 1.021 | |
| (4,) | kernel_04 | -1127.952 | 93.165 | -1283.961 | -1125.748 | -978.007 | 4000 | 287.206 | 523.644 | 1.017 | |
| (5,) | kernel_04 | -59.236 | 32.689 | -112.265 | -59.756 | -5.968 | 4000 | 174.249 | 355.672 | 1.018 | |
| (6,) | kernel_04 | -213.544 | 20.962 | -246.796 | -214.359 | -179.102 | 4000 | 143.348 | 633.100 | 1.038 | |
| (7,) | kernel_04 | 115.530 | 71.315 | 12.799 | 108.984 | 239.090 | 4000 | 154.495 | 199.531 | 1.024 | |
| (8,) | kernel_04 | 30.199 | 18.463 | 3.722 | 28.654 | 61.787 | 4000 | 143.278 | 197.396 | 1.036 | |
| loc_np0_tau2 | () | kernel_03 | 735262.000 | 559525.062 | 253877.688 | 592855.656 | 1666969.462 | 4000 | 1352.310 | 2737.206 | 1.003 |
| loc_p0_beta | (0,) | kernel_05 | -23.949 | 1.557 | -26.545 | -23.892 | -21.367 | 4000 | 13.121 | 20.016 | 1.246 |
| scale_np0_beta | (0,) | kernel_01 | 8.056 | 10.744 | -6.509 | 5.540 | 27.736 | 4000 | 37.591 | 150.933 | 1.103 |
| (1,) | kernel_01 | -1.407 | 5.931 | -11.598 | -1.060 | 8.103 | 4000 | 210.887 | 401.406 | 1.014 | |
| (2,) | kernel_01 | -17.430 | 9.659 | -33.542 | -17.559 | -2.789 | 4000 | 28.120 | 129.904 | 1.123 | |
| (3,) | kernel_01 | 10.911 | 5.240 | 2.846 | 10.915 | 19.429 | 4000 | 39.408 | 147.850 | 1.088 | |
| (4,) | kernel_01 | 2.692 | 4.240 | -4.188 | 2.627 | 9.817 | 4000 | 56.953 | 294.239 | 1.073 | |
| (5,) | kernel_01 | 4.076 | 1.937 | 1.095 | 3.922 | 7.346 | 4000 | 24.444 | 117.743 | 1.118 | |
| (6,) | kernel_01 | -0.588 | 3.199 | -6.105 | -0.386 | 4.074 | 4000 | 21.601 | 122.160 | 1.138 | |
| (7,) | kernel_01 | -0.311 | 3.659 | -5.933 | -0.648 | 6.267 | 4000 | 92.055 | 165.632 | 1.033 | |
| (8,) | kernel_01 | -1.197 | 1.925 | -4.500 | -1.071 | 1.700 | 4000 | 26.872 | 131.637 | 1.122 | |
| scale_np0_tau2 | () | kernel_00 | 137.908 | 162.827 | 10.762 | 85.152 | 428.775 | 4000 | 27.860 | 179.005 | 1.113 |
| scale_p0_beta | (0,) | kernel_02 | 2.763 | 0.070 | 2.653 | 2.762 | 2.879 | 4000 | 163.264 | 926.926 | 1.024 |
Error summary:
| count | relative | ||||
|---|---|---|---|---|---|
| kernel | error_code | error_msg | phase | ||
| kernel_01 | 90 | nan acceptance prob | warmup | 17 | 0.001 |
| posterior | 0 | 0.000 | |||
| kernel_02 | 90 | nan acceptance prob | warmup | 4 | 0.000 |
| posterior | 0 | 0.000 |
fig = gs.plot_trace(results, "loc_p0_beta")
/opt/hostedtoolcache/Python/3.10.12/x64/lib/python3.10/site-packages/seaborn/axisgrid.py:118: UserWarning: The figure layout has changed to tight
  self._figure.tight_layout(*args, **kwargs)
/opt/hostedtoolcache/Python/3.10.12/x64/lib/python3.10/site-packages/seaborn/axisgrid.py:118: UserWarning: The figure layout has changed to tight
  self._figure.tight_layout(*args, **kwargs)
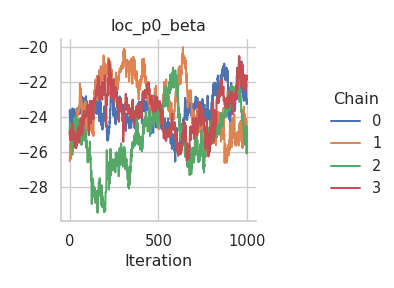
fig = gs.plot_trace(results, "loc_np0_tau2")
/opt/hostedtoolcache/Python/3.10.12/x64/lib/python3.10/site-packages/seaborn/axisgrid.py:118: UserWarning: The figure layout has changed to tight
  self._figure.tight_layout(*args, **kwargs)
/opt/hostedtoolcache/Python/3.10.12/x64/lib/python3.10/site-packages/seaborn/axisgrid.py:118: UserWarning: The figure layout has changed to tight
  self._figure.tight_layout(*args, **kwargs)
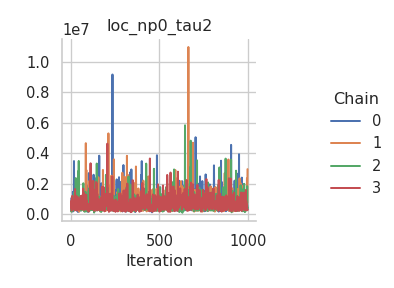
fig = gs.plot_trace(results, "loc_np0_beta")
/opt/hostedtoolcache/Python/3.10.12/x64/lib/python3.10/site-packages/seaborn/axisgrid.py:118: UserWarning: The figure layout has changed to tight
  self._figure.tight_layout(*args, **kwargs)
/opt/hostedtoolcache/Python/3.10.12/x64/lib/python3.10/site-packages/seaborn/axisgrid.py:118: UserWarning: The figure layout has changed to tight
  self._figure.tight_layout(*args, **kwargs)
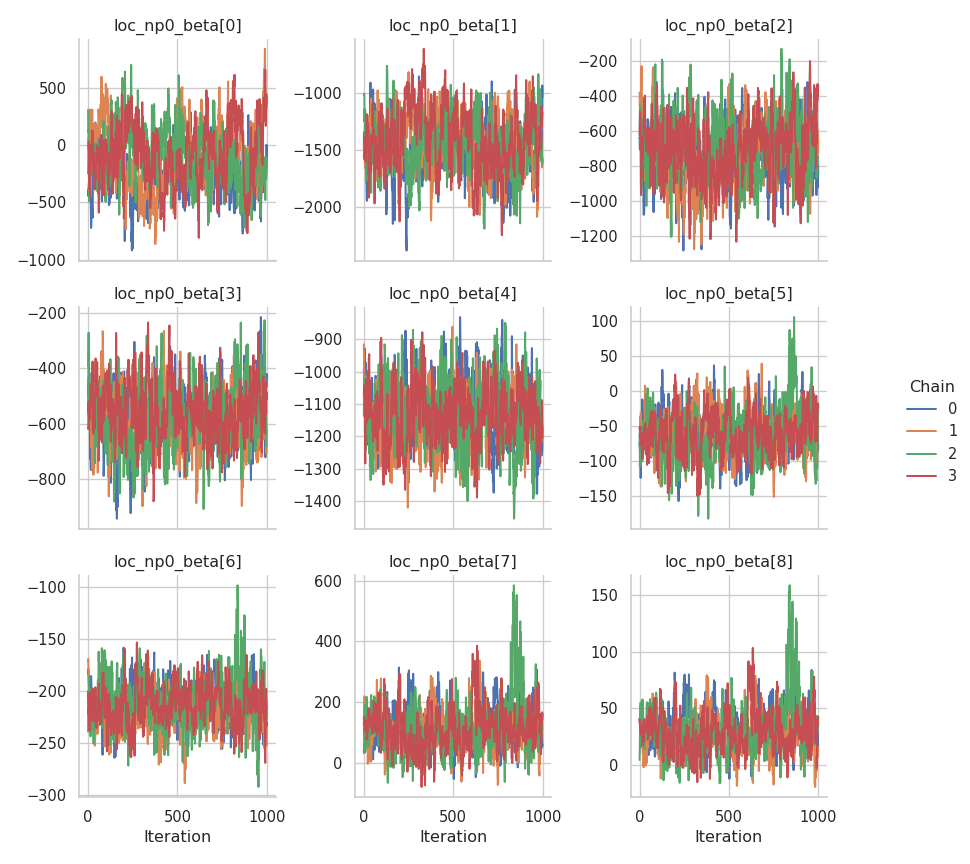
fig = gs.plot_trace(results, "scale_p0_beta")
/opt/hostedtoolcache/Python/3.10.12/x64/lib/python3.10/site-packages/seaborn/axisgrid.py:118: UserWarning: The figure layout has changed to tight
  self._figure.tight_layout(*args, **kwargs)
/opt/hostedtoolcache/Python/3.10.12/x64/lib/python3.10/site-packages/seaborn/axisgrid.py:118: UserWarning: The figure layout has changed to tight
  self._figure.tight_layout(*args, **kwargs)
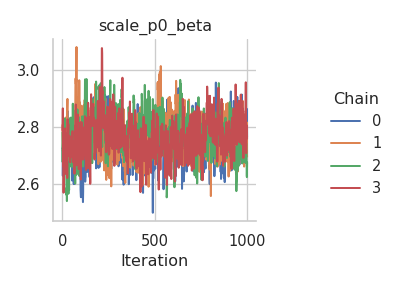
fig = gs.plot_trace(results, "scale_np0_tau2")
/opt/hostedtoolcache/Python/3.10.12/x64/lib/python3.10/site-packages/seaborn/axisgrid.py:118: UserWarning: The figure layout has changed to tight
  self._figure.tight_layout(*args, **kwargs)
/opt/hostedtoolcache/Python/3.10.12/x64/lib/python3.10/site-packages/seaborn/axisgrid.py:118: UserWarning: The figure layout has changed to tight
  self._figure.tight_layout(*args, **kwargs)
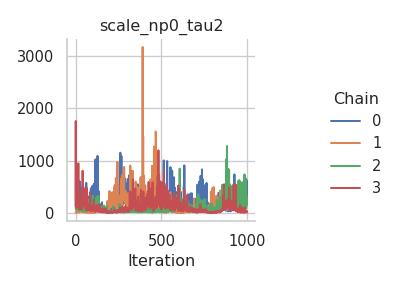
fig = gs.plot_trace(results, "scale_np0_beta")
/opt/hostedtoolcache/Python/3.10.12/x64/lib/python3.10/site-packages/seaborn/axisgrid.py:118: UserWarning: The figure layout has changed to tight
  self._figure.tight_layout(*args, **kwargs)
/opt/hostedtoolcache/Python/3.10.12/x64/lib/python3.10/site-packages/seaborn/axisgrid.py:118: UserWarning: The figure layout has changed to tight
  self._figure.tight_layout(*args, **kwargs)
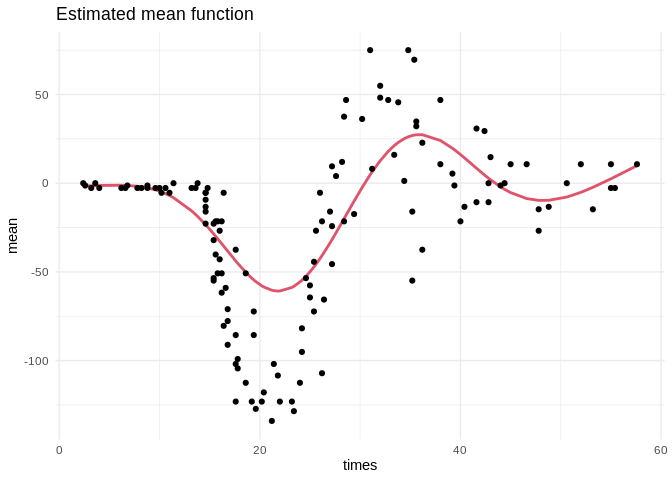
To confirm that the chains have converged to reasonable values, here is a plot of the estimated mean function:
summary = gs.Summary(results).to_dataframe().reset_index()
library(dplyr)
Attaching package: 'dplyr'

The following object is masked from 'package:MASS':

    select

The following objects are masked from 'package:stats':

    filter, lag

The following objects are masked from 'package:base':

    intersect, setdiff, setequal, union
library(ggplot2)
library(reticulate)

summary <- py$summary

beta <- summary %>%
  filter(variable == "loc_np0_beta") %>%
  group_by(var_index) %>%
  summarize(mean = mean(mean)) %>%
  ungroup()

beta <- beta$mean
X <- py_to_r(model$vars["loc_np0_X"]$value)
f <- X %*% beta

beta0 <- summary %>%
  filter(variable == "loc_p0_beta") %>%
  group_by(var_index) %>%
  summarize(mean = mean(mean)) %>%
  ungroup()

beta0 <- beta0$mean

ggplot(data.frame(times = mcycle$times, mean = beta0 + f)) +
  geom_line(aes(times, mean), color = palette()[2], size = 1) +
  geom_point(aes(times, accel), data = mcycle) +
  ggtitle("Estimated mean function") +
  theme_minimal()
NUTS sampler#
As an alternative, we try a NUTS kernel which samples all model parameters (regression coefficients and smoothing parameters) in one block. To do so, we first need to log-transform the smoothing parameters. This is the model graph before the transformation:
lsl.plot_vars(model)
![]()
Before transforming the smoothing parameters with the
lsl.transform_parameter() function, we first need to copy all model
nodes. Once this is done, we need to update the output nodes of the
smoothing parameters and rebuild the model. There are two additional
nodes in the new model graph.
import tensorflow_probability.substrates.jax.bijectors as tfb

nodes, _vars = model.pop_nodes_and_vars()

gb = lsl.GraphBuilder()
gb.add(_vars["response"])
GraphBuilder(0 nodes, 1 vars)
_ = gb.transform(_vars["loc_np0_tau2"], tfb.Exp)
_ = gb.transform(_vars["scale_np0_tau2"], tfb.Exp)
model = gb.build_model()
lsl.plot_vars(model)
![]()
Now we can set up the NUTS sampler, which is straightforward because we are using only one kernel.
parameters = [name for name, var in model.vars.items() if var.parameter]

builder = gs.EngineBuilder(seed=42, num_chains=4)

builder.set_model(lsl.GooseModel(model))
builder.add_kernel(gs.NUTSKernel(parameters))
builder.set_initial_values(model.state)

builder.set_duration(warmup_duration=5000, posterior_duration=1000)

engine = builder.build()
liesel.goose.engine - INFO - Initializing kernels...
liesel.goose.engine - INFO - Done
engine.sample_all_epochs()
liesel.goose.engine - INFO - Starting epoch: FAST_ADAPTATION, 75 transitions, 25 jitted together
liesel.goose.engine - WARNING - Errors per chain for kernel_00: 45, 31, 51, 61 / 75 transitions
liesel.goose.engine - INFO - Finished epoch
liesel.goose.engine - INFO - Starting epoch: SLOW_ADAPTATION, 25 transitions, 25 jitted together
liesel.goose.engine - WARNING - Errors per chain for kernel_00: 9, 21, 13, 8 / 25 transitions
liesel.goose.engine - INFO - Finished epoch
liesel.goose.engine - INFO - Starting epoch: SLOW_ADAPTATION, 50 transitions, 25 jitted together
liesel.goose.engine - WARNING - Errors per chain for kernel_00: 40, 50, 49, 46 / 50 transitions
liesel.goose.engine - INFO - Finished epoch
liesel.goose.engine - INFO - Starting epoch: SLOW_ADAPTATION, 100 transitions, 25 jitted together
liesel.goose.engine - WARNING - Errors per chain for kernel_00: 93, 93, 97, 91 / 100 transitions
liesel.goose.engine - INFO - Finished epoch
liesel.goose.engine - INFO - Starting epoch: SLOW_ADAPTATION, 200 transitions, 25 jitted together
liesel.goose.engine - WARNING - Errors per chain for kernel_00: 196, 196, 192, 191 / 200 transitions
liesel.goose.engine - INFO - Finished epoch
liesel.goose.engine - INFO - Starting epoch: SLOW_ADAPTATION, 400 transitions, 25 jitted together
liesel.goose.engine - WARNING - Errors per chain for kernel_00: 388, 371, 382, 381 / 400 transitions
liesel.goose.engine - INFO - Finished epoch
liesel.goose.engine - INFO - Starting epoch: SLOW_ADAPTATION, 800 transitions, 25 jitted together
liesel.goose.engine - WARNING - Errors per chain for kernel_00: 789, 760, 772, 768 / 800 transitions
liesel.goose.engine - INFO - Finished epoch
liesel.goose.engine - INFO - Starting epoch: SLOW_ADAPTATION, 3300 transitions, 25 jitted together
liesel.goose.engine - WARNING - Errors per chain for kernel_00: 3138, 3198, 3213, 3213 / 3300 transitions
liesel.goose.engine - INFO - Finished epoch
liesel.goose.engine - INFO - Starting epoch: FAST_ADAPTATION, 50 transitions, 25 jitted together
liesel.goose.engine - WARNING - Errors per chain for kernel_00: 46, 47, 48, 49 / 50 transitions
liesel.goose.engine - INFO - Finished epoch
liesel.goose.engine - INFO - Finished warmup
liesel.goose.engine - INFO - Starting epoch: POSTERIOR, 1000 transitions, 25 jitted together
liesel.goose.engine - WARNING - Errors per chain for kernel_00: 999, 999, 998, 998 / 1000 transitions
liesel.goose.engine - INFO - Finished epoch
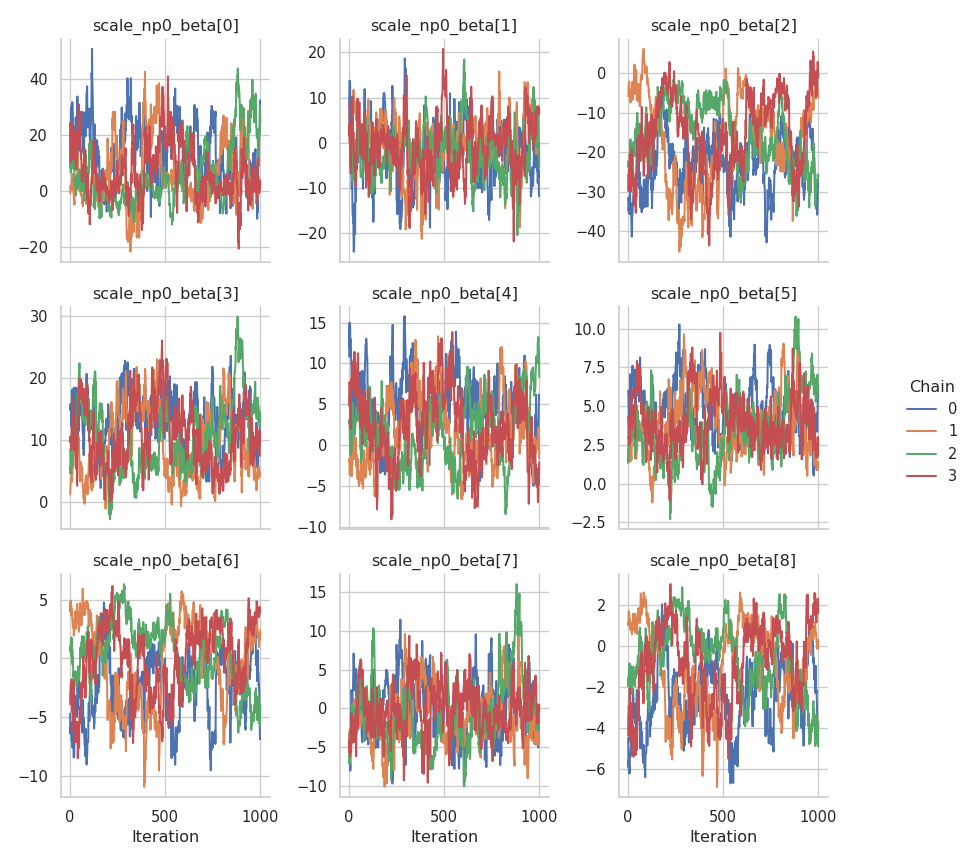
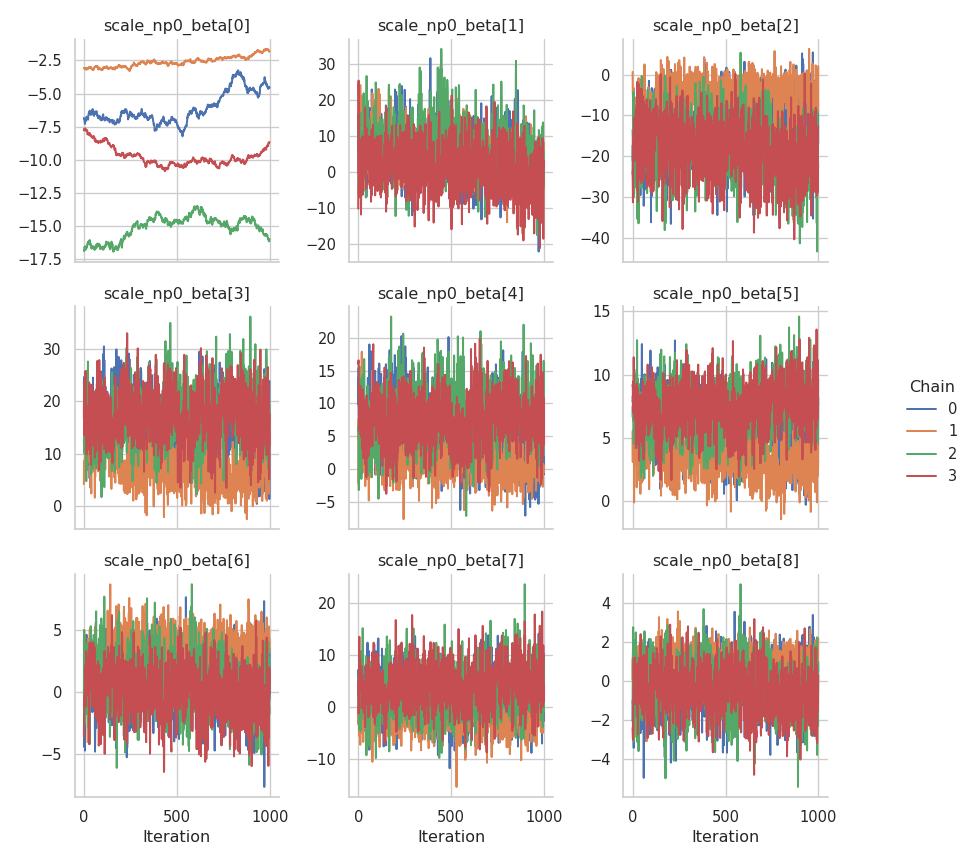
The results are mixed. On the one hand, the NUTS sampler performs much better on the intercepts (for both the mean and the standard deviation), but on the other hand, the Metropolis-in-Gibbs sampler with the IWLS kernels seems to work better for the spline coefficients.
results = engine.get_results()
gs.Summary(results)
Parameter summary:
| kernel | mean | sd | q_0.05 | q_0.5 | q_0.95 | sample_size | ess_bulk | ess_tail | rhat | ||
|---|---|---|---|---|---|---|---|---|---|---|---|
| parameter | index | ||||||||||
| loc_np0_beta | (0,) | kernel_00 | 69.469 | 94.074 | -19.308 | 24.245 | 235.016 | 4000 | 4.338 | 11.485 | 3.937 |
| (1,) | kernel_00 | -34.872 | 29.647 | -79.634 | -31.955 | 12.604 | 4000 | 4.462 | 10.910 | 3.398 | |
| (2,) | kernel_00 | -225.643 | 173.152 | -489.674 | -190.451 | -2.248 | 4000 | 4.560 | 12.395 | 3.057 | |
| (3,) | kernel_00 | -29.091 | 129.928 | -242.193 | -10.036 | 216.950 | 4000 | 4.723 | 11.857 | 2.639 | |
| (4,) | kernel_00 | -712.810 | 135.987 | -969.966 | -716.210 | -480.268 | 4000 | 4.894 | 11.407 | 2.437 | |
| (5,) | kernel_00 | -82.669 | 42.168 | -153.224 | -73.919 | -23.744 | 4000 | 5.571 | 12.573 | 1.928 | |
| (6,) | kernel_00 | -130.846 | 30.345 | -176.981 | -132.647 | -81.529 | 4000 | 5.781 | 18.869 | 1.858 | |
| (7,) | kernel_00 | 29.494 | 41.749 | -25.851 | 29.180 | 105.536 | 4000 | 4.729 | 11.952 | 2.677 | |
| (8,) | kernel_00 | 20.231 | 9.427 | 5.199 | 20.017 | 38.063 | 4000 | 5.258 | 13.983 | 2.151 | |
| loc_np0_tau2_transformed | () | kernel_00 | 11.376 | 0.689 | 10.245 | 11.377 | 12.506 | 4000 | 10.741 | 23.437 | 1.277 |
| loc_p0_beta | (0,) | kernel_00 | -17.948 | 3.408 | -23.355 | -18.022 | -12.076 | 4000 | 9.897 | 53.404 | 1.330 |
| scale_np0_beta | (0,) | kernel_00 | -8.401 | 4.703 | -16.181 | -7.819 | -2.281 | 4000 | 4.401 | 11.172 | 3.516 |
| (1,) | kernel_00 | 4.151 | 6.940 | -6.551 | 3.753 | 16.141 | 4000 | 25.731 | 81.149 | 1.100 | |
| (2,) | kernel_00 | -14.150 | 8.351 | -28.065 | -13.854 | -1.076 | 4000 | 9.980 | 64.035 | 1.310 | |
| (3,) | kernel_00 | 14.462 | 6.344 | 3.769 | 14.785 | 24.659 | 4000 | 10.223 | 34.126 | 1.301 | |
| (4,) | kernel_00 | 6.075 | 4.746 | -1.435 | 6.085 | 13.940 | 4000 | 12.279 | 81.324 | 1.236 | |
| (5,) | kernel_00 | 5.980 | 2.517 | 1.815 | 6.063 | 9.952 | 4000 | 9.152 | 41.744 | 1.355 | |
| (6,) | kernel_00 | 1.213 | 2.341 | -2.705 | 1.275 | 4.874 | 4000 | 13.211 | 102.812 | 1.209 | |
| (7,) | kernel_00 | 1.880 | 4.552 | -4.995 | 1.612 | 9.654 | 4000 | 16.937 | 399.531 | 1.159 | |
| (8,) | kernel_00 | -0.124 | 1.276 | -2.398 | -0.052 | 1.820 | 4000 | 26.935 | 1328.627 | 1.095 | |
| scale_np0_tau2_transformed | () | kernel_00 | 4.447 | 1.022 | 2.551 | 4.586 | 5.955 | 4000 | 9.088 | 29.637 | 1.357 |
| scale_p0_beta | (0,) | kernel_00 | 3.004 | 0.076 | 2.878 | 3.005 | 3.127 | 4000 | 15.581 | 183.202 | 1.177 |
Error summary:
| count | relative | ||||
|---|---|---|---|---|---|
| kernel | error_code | error_msg | phase | ||
| kernel_00 | 1 | divergent transition | warmup | 2586 | 0.129 |
| posterior | 0 | 0.000 | |||
| 2 | maximum tree depth | warmup | 15753 | 0.788 | |
| posterior | 3994 | 0.998 | |||
| 3 | divergent transition + maximum tree depth | warmup | 797 | 0.040 | |
| posterior | 0 | 0.000 |
fig = gs.plot_trace(results, "loc_p0_beta")
/opt/hostedtoolcache/Python/3.10.12/x64/lib/python3.10/site-packages/seaborn/axisgrid.py:118: UserWarning: The figure layout has changed to tight
  self._figure.tight_layout(*args, **kwargs)
/opt/hostedtoolcache/Python/3.10.12/x64/lib/python3.10/site-packages/seaborn/axisgrid.py:118: UserWarning: The figure layout has changed to tight
  self._figure.tight_layout(*args, **kwargs)
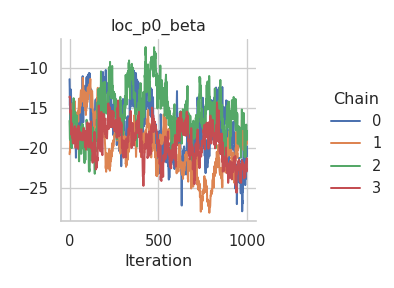
fig = gs.plot_trace(results, "loc_np0_tau2_transformed")
/opt/hostedtoolcache/Python/3.10.12/x64/lib/python3.10/site-packages/seaborn/axisgrid.py:118: UserWarning: The figure layout has changed to tight
  self._figure.tight_layout(*args, **kwargs)
/opt/hostedtoolcache/Python/3.10.12/x64/lib/python3.10/site-packages/seaborn/axisgrid.py:118: UserWarning: The figure layout has changed to tight
  self._figure.tight_layout(*args, **kwargs)
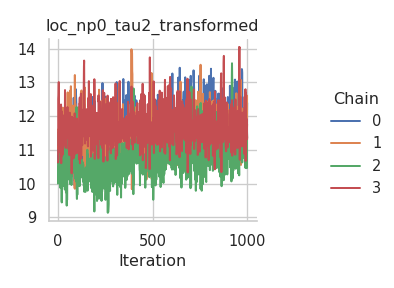
fig = gs.plot_trace(results, "loc_np0_beta")
/opt/hostedtoolcache/Python/3.10.12/x64/lib/python3.10/site-packages/seaborn/axisgrid.py:118: UserWarning: The figure layout has changed to tight
  self._figure.tight_layout(*args, **kwargs)
/opt/hostedtoolcache/Python/3.10.12/x64/lib/python3.10/site-packages/seaborn/axisgrid.py:118: UserWarning: The figure layout has changed to tight
  self._figure.tight_layout(*args, **kwargs)
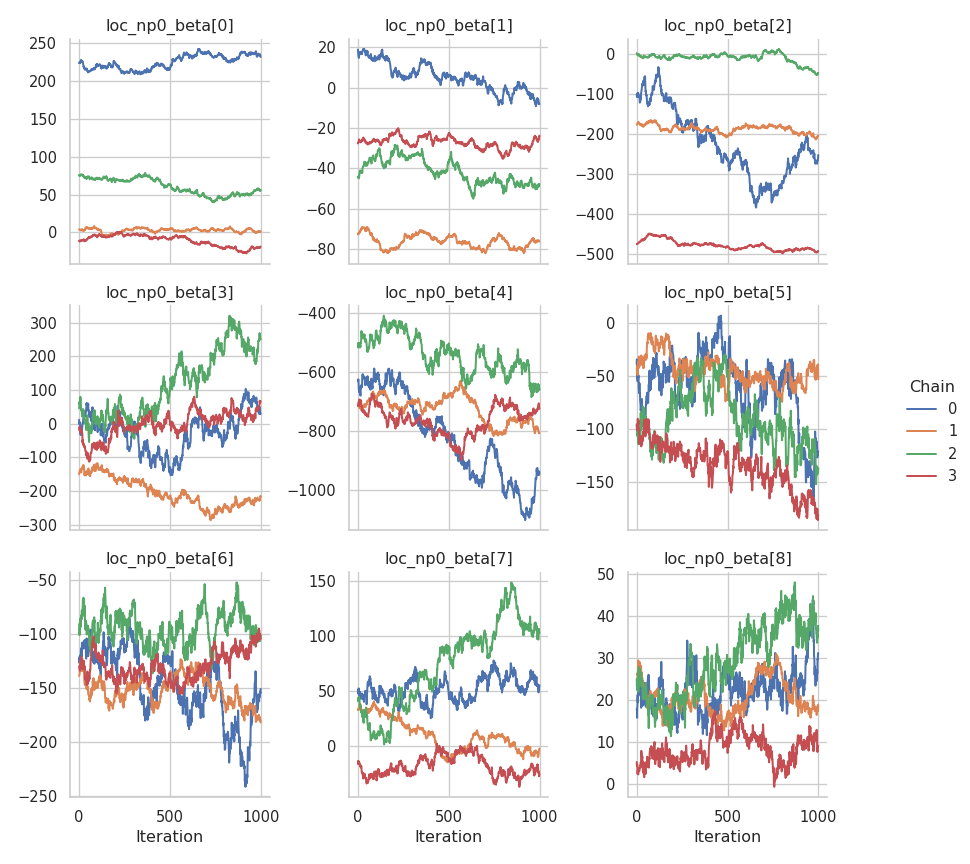
fig = gs.plot_trace(results, "scale_p0_beta")
/opt/hostedtoolcache/Python/3.10.12/x64/lib/python3.10/site-packages/seaborn/axisgrid.py:118: UserWarning: The figure layout has changed to tight
  self._figure.tight_layout(*args, **kwargs)
/opt/hostedtoolcache/Python/3.10.12/x64/lib/python3.10/site-packages/seaborn/axisgrid.py:118: UserWarning: The figure layout has changed to tight
  self._figure.tight_layout(*args, **kwargs)
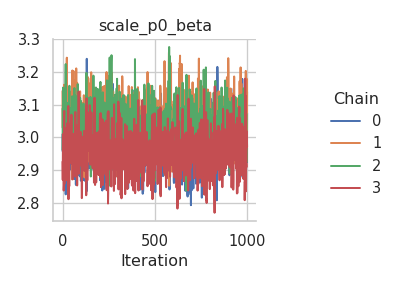
fig = gs.plot_trace(results, "scale_np0_tau2_transformed")
/opt/hostedtoolcache/Python/3.10.12/x64/lib/python3.10/site-packages/seaborn/axisgrid.py:118: UserWarning: The figure layout has changed to tight
  self._figure.tight_layout(*args, **kwargs)
/opt/hostedtoolcache/Python/3.10.12/x64/lib/python3.10/site-packages/seaborn/axisgrid.py:118: UserWarning: The figure layout has changed to tight
  self._figure.tight_layout(*args, **kwargs)
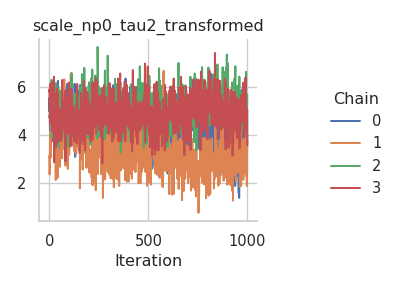
fig = gs.plot_trace(results, "scale_np0_beta")
/opt/hostedtoolcache/Python/3.10.12/x64/lib/python3.10/site-packages/seaborn/axisgrid.py:118: UserWarning: The figure layout has changed to tight
  self._figure.tight_layout(*args, **kwargs)
/opt/hostedtoolcache/Python/3.10.12/x64/lib/python3.10/site-packages/seaborn/axisgrid.py:118: UserWarning: The figure layout has changed to tight
  self._figure.tight_layout(*args, **kwargs)
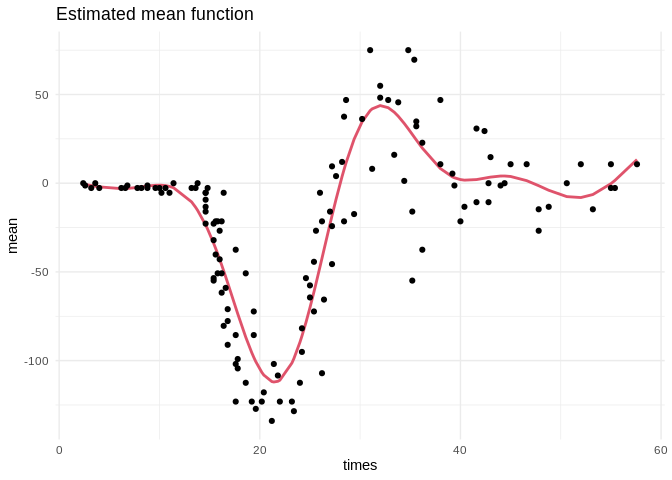
Again, here is a plot of the estimated mean function:
summary = gs.Summary(results).to_dataframe().reset_index()
library(dplyr)
library(ggplot2)
library(reticulate)

summary <- py$summary
model <- py$model

beta <- summary %>%
  filter(variable == "loc_np0_beta") %>%
  group_by(var_index) %>%
  summarize(mean = mean(mean)) %>%
  ungroup()

beta <- beta$mean
X <- model$vars["loc_np0_X"]$value
f <- X %*% beta

beta0 <- summary %>%
  filter(variable == "loc_p0_beta") %>%
  group_by(var_index) %>%
  summarize(mean = mean(mean)) %>%
  ungroup()

beta0 <- beta0$mean

ggplot(data.frame(times = mcycle$times, mean = beta0 + f)) +
  geom_line(aes(times, mean), color = palette()[2], size = 1) +
  geom_point(aes(times, accel), data = mcycle) +
  ggtitle("Estimated mean function") +
  theme_minimal()